

This is going to be a very interesting article about gpu memory bandwidth.


Findings? What should I call this section?
Running the microbenchmarks on various hardware has been very insightful. From learning various quirks in different chips, to finding surprising bottlenecks in our microbenchmark.
IMPORTANT NOTE: These benchmarks are not comparisons as to which GPU is ‘better’. They are just measurements to learn about the different GPU architectures. For this reason, we have opted to use GPUs from different price brackets. We are not interested in ‘this number is higher on this GPU’, but more interested in what patterns are slow or fast on a given piece of hardware. If you are interested in comparing the real-world performance of GPUs, the Evolve benchmark suite is great for this!
Qualcomm Adreno 740 (Meta Quest 3)
Let’s start of with a mobile chip, the Qualcomm Adreno 740 in the Meta Quest 3. On this hardware, we found some interesting data about using buffers vs textures. We found it to be fairly common for there to be a difference in bandwidth for data in cache across many GPUs. However, on the Quest 3 we found a significant bandwidth difference in main memory. It is significant enough that, when designing software specifically for this hardware, it would be worth it to replace large buffers with textures to achieve a 2x to nearly 3x bandwidth improvement.
It is important to note that we do see higher bandwidth for small buffers and that this benchmark does not measure latency.
AMD RX 9070 XT
On AMD’s latest GPU architecture, we ran into an interesting problem. When measuring the bandwidth, we noticed a significant difference in performance when loading floating-point values vs integers. This had us quite confused since, from a hardware perspective, it should not matter whether you load an integer or a float.
It turns out we were running into an ALU bottleneck in our bandwidth benchmark! Just performing one integer multiplication per load was enough to be a bottleneck. When we replaced our dummy multiply op with an addition, we were able to measure the same bandwidth for both integer and floating point values.
I suppose we did not expect AMD’s L0 cache to be that fast. We managed to measure it higher than 21 TB/s when loading from a buffer. When loading from a storage texture, we only managed to reach 12 TB/s.

Findings
Running the microbenchmarks on various hardware has been very insightful. From learning various quirks in different chips, to finding surprising bottlenecks in our microbenchmark.
IMPORTANT NOTE: These benchmarks are not comparisons as to which GPU is ‘better’. They are just measurements to learn about the different GPU architectures. For this reason, we have opted to use GPUs from different price brackets. We are not interested in ‘this number is higher on this GPU’, but more interested in what patterns are slow or fast on a given piece of hardware. If you are interested in comparing the real-world performance of GPUs, the Evolve benchmark suite is great for this!
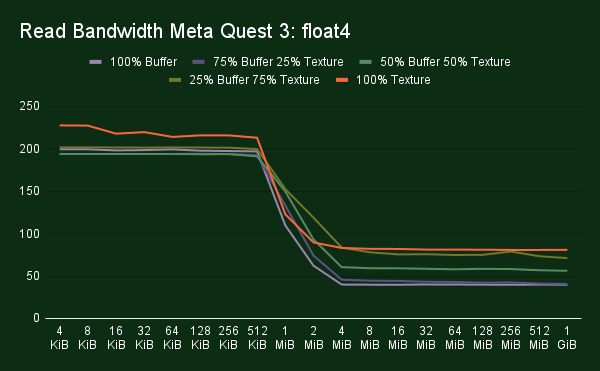
Qualcomm Adreno 740 (Meta Quest 3)
Let’s start of with a mobile chip, the Qualcomm Adreno 740 in the Meta Quest 3. This GPU has 12 Shader Processors, which each consist out of 2 micro Shader Processors. We find a block of 1 KiB L1 cache per micro Shader Processor. Additionally, there is a block of shared L2 cache, and then further on a system level cache, which is usually shared with the CPU. From our measurements we see drop offs in read bandwidth after 128 KiB, 1MiB, and 8 MiB. For the write bandwidth we see clear drop off in performance at 512 KiB, but further drop offs after that are not quite as clear.
Other than differences in bandwidth btween the caches we found some interesting data about using buffers vs textures. We found it to be fairly common for there to be a difference in bandwidth for data in cache across many GPUs. However, on the Quest 3 we found a significant bandwidth difference in main memory. It is significant enough that, when designing software specifically for this hardware, it would be worth it to replace large buffers with textures to achieve a near 3x bandwidth improvement from around 46 GiB/s to over 130 GiB/s.
Also interesting to note is that we hit the highest VRAM bandwidth of 143 GiB/s when we mix in 25% buffer loads. Additionally, we can see that using buffers is fine as long as we manage to hit the cache. When writing code we would recommend to use whichever resource type is most natural, but when optimizing for the Meta Quest 3 you might want to replace specific large buffers with textures to get that higher bandwidth.


AMD RX 9070 XT
AMD has excellent documentation on what their hardware looks like. With the introduction of the RDNA architecture they released a white paper detailing the major differences, as well as releasing slides with what is new with each new iteration of their architecture. On top of that we also get a fully documented ISA full of little hardware details.

An AMD RDNA 4 GPU is built out of a various number of Shader Engines. Each Shader Engine consists out of two Shader Arrays, and each Shader Array contains some Work Group Processors. In the case of the RX 9070 XT there are a total of 4 Shader Engines with 4 Work Group Processors per Shader Array. The Work Group Processor consists out of 4 SIMDs divided into two Dual Compute Units. In a Work Group Processor we find 16KiB of scalar cache, 32 KiB of instruction cache, 128 KiB for groupshared memory, as well as two blocks of 32 KiB L0 cache, one for each Dual Compute Unit. Per Shader Array we find 256 KiB of L1 cache. This cache is also used for coherency gathering the load/store requests before moving on to the 8 MiB of L2 cache. Finally RDNA 4 has 64 MiB of infinity cache, which on RDNA 3 was on separate chiplets, is back on a monolith die in RDNA 4.

When benchmarking the RX 9070 XT, we ran into an interesting problem. When measuring the bandwidth, we noticed a significant difference in performance when loading floating-point values vs integers. This had us quite confused since, from a hardware perspective, it should not matter whether you load an integer or a float.
It turns out we were running into an ALU bottleneck in our bandwidth benchmark! Just performing one integer multiplication per load was enough to be a bottleneck. When we replaced our dummy multiply op with an addition, we were able to measure the same bandwidth for both integer and floating point values.
I suppose we did not expect AMD’s L0 cache to be that fast. We managed to measure it at nearly 20 TiB/s when loading from a buffer. When loading from a storage texture, we only managed to reach 11 TiB/s.


Intel Arc B580
Battlemage is Intel's second discrete GPU architecture. When Battlemage was announced Intel release some diagrams describing what their new GPU looks like giving us some interesting insights.

The battlemage GPU architecture is built out of Render Slices, 5 in the case of the B580. Each Render Slice contains 4 Xe Cores as well as 4 Ray Tracing Units, 4 Samplers and some blocks for rasterization. In side each Xe Core we find 8 Xe2 Vector Engines, 96 KiB of instruction cache and 256 KiB of L1 Cache. The L1 block is also used groupshared memory usage where the block can be partitioned as needed. The main block of L2 cache is 18 MiB in size.

The B580 surprised us when comparing 4-byte vs 16-byte loads when loading from textures vs buffers. We found that for buffers bandwidth goes down for larger data types, while for textures bandwidth goes up for larger data types. This would suggest that data paths via buffers and textures, for the caches at least, seem to be optimized for different use cases.
A second interesting find is that when reading or writing 12-byte element from and to a buffer, performance increases as we move to a later cache level. We are not sure why this is the case, but it is interesting nonetheless.


NVIDIA RTX 5070 Ti
NVIDIA's Blackwell architecture is by far the largest scaled of all all the current generation GPUs. When the new architecture was released they also released a white paper describing all the changes as well as some very useful diagrams. The diagram is released is of their full GB202 chip, of which a slightly cut down version is found in the RTX 5090, likely due to binning.


The RTX 5070 Ti we tested uses the same architecture but a smaller version of the chip. On chip we find 6 Graphics Processing Clusters (GPC), 35 Texture Processing Units (TPC), and 70 Shader Multiprocessors (SM). On the GPU we find 48 MiB of L2 cache, and as we zoom into the SM we find 128 KiB of L1 cache on each of them. The L1 block is also used for groupshared memory and can be split up with 10 different configurations ranging from 0 KiB to 228 KiB used for groupshared.
In benchmarking the RTX 5070 Ti we found that many writes to the same small piece of memory causes a large bottleneck reducing performance massively. To be fair, this is not a use case with any real world computation uses, but it's interesting to see and makes us wonder what exactly is happening in the hardware that causes this.
Another interesting find is that we saw a large decrease in read bandwidth when reading a uint1 from a buffer vs a float1. So far we found on AMD's RX 9070 XT that integer multiplies caused an ALU bottleneck. This case is different, as it's only the buffer loads are affected, not the texture loads. We have reran the microbench but got the same results back. So far we have not been able to explain why there is a difference in performance in this specific case.


Conclusion
With our new bandwidth microbenchmark we are just scratching the surface of what we can discover. So far we have been able to find that some paths can be faster on certain hardware like using textures vs buffers on the Meta Quest 3, or that loading 12-byte elements on Intel doesn't do well on the caches closests to the shader cores. However, we also found patterns that still remain a mystery to us. As we further develop our microbenchmarks we hope to uncover more insights on the hardware.
Generally we don't let one pattern being slower or faster on one specific vendor affect the way we write code, as we don't want to favor one GPU vendor over another. However the common patterns are certainly helpful. Additionally for projects targetting specific hardware that are not Evolve related, this type of data can helps us to squeeze every bit of performance out.
We already have a lot of ideas for more microbenchmarks we want to build and try out. When we find some more interesting results we will share them with another blog posts so keep your eyes out for that!
Sources:
- https://chipsandcheese.com/p/inside-snapdragon-8-gen-1s-igpu-adreno-gets-big
- https://www.techpowerup.com/gpu-specs/radeon-rx-9070-xt.c4229
- https://www.amd.com/content/dam/amd/en/documents/radeon-tech-docs/instruction-set-architectures/rdna4-instruction-set-architecture.pdf
- https://www.techpowerup.com/review/amd-radeon-rx-9070-series-technical-deep-dive/3.html
- https://images.nvidia.com/aem-dam/Solutions/geforce/blackwell/nvidia-rtx-blackwell-gpu-architecture.pdf
- https://download.intel.com/newsroom/2024/client-computing/Intel-Arc-B580-B570-Media-Deck.pdf